
New Google Maps feature shows overcrowded places in real time
We analyze the evolution of Google Maps algorithms for monitoring crowded areas. Discover how real-time location data interpretation is changing travel planning and the urban experience, offering a new perspective on crowd density in neighborhoods.

The perception of urban space is changing radically, driven by the data flows traversing our digital infrastructures. At GoBooksy, we observe daily how information processing is no longer just a static calculation of distances, but a dynamic reading of human behavior. The update allowing Google Maps to show crowded places in real time represents a significant qualitative leap: we are no longer looking at a map, but at a living organism that pulses based on the presence of people.
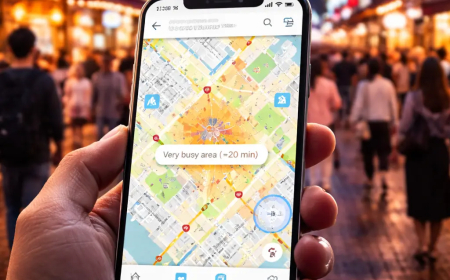
Until recently, our interaction with digital maps was limited to finding the fastest route or checking if a single store was open. Today, working with geolocation technologies and data analysis, we notice how the need has shifted towards understanding context. The "Area Busyness" feature answers a much more complex question than simple navigation: what is the energy of a neighborhood at this precise moment? This technology identifies zones of interest, such as shopping streets, nightlife districts, or tourist areas, and highlights them on the map when the concentration of devices exceeds the historical average.
From a technical standpoint, the mechanism we analyze behind this feature is fascinating because it relies on a precarious balance between utility and privacy. Google uses aggregated and anonymized data from the Location History of users who have opted into the service. There is no "Big Brother" watching the individual, but a statistical system detecting anomalous densities. When we see an area turn amber or the "Busy area" label appear, we are visualizing the result of a massive calculation comparing current GPS signals with historical models of that specific zone. At GoBooksy, we know well that managing this volume of data in real time requires impressive cloud computing power, capable of filtering background noise and returning clean, usable information in a few milliseconds.
The operational impact of this function goes far beyond simple curiosity. For those moving for work or organizing logistical activities, knowing in advance if a neighborhood is saturated allows for the avoidance of bottlenecks that simple vehicle traffic monitoring does not detect. We often have to plan movements or activities in dense urban contexts; information on pedestrian overcrowding becomes crucial for predicting service delays, parking difficulties, or simply the inability to move agilely. It is a tool that transforms the unforeseen into a calculable variable.
However, interpreting this data requires critical competence. We have noticed that system reliability depends heavily on the density of active users in a given area. In zones with poor network coverage or limited smartphone usage, the map might not reflect physical reality. Furthermore, the algorithm tends to interpret "crowd" in a statistical sense: a sudden event gathering many people in an unusual spot is detected immediately, but the nature of that gathering—whether a party or an emergency—is not always explicit, leaving the burden of verification to the user.
Visualizing overcrowding also introduces an interesting psychological dynamic in leisure time management. While it helps those seeking tranquility to avoid hot zones, it simultaneously attracts those seeking social interaction toward neuralgic points, risking further fueling the congestion it signals. It is a paradox typical of digital systems monitoring human behavior: observation alters the observed phenomenon. At GoBooksy, we believe true utility lies in awareness. It is not about letting the algorithm dictate where to go, but about having a complete picture of environmental conditions to decide autonomously.
This evolution marks the definitive transition of maps from consultation tools to behavioral prediction tools. The city is no longer a labyrinth of immutable streets, but a constantly changing data flow. Understanding how to read these signals, distinguishing between a statistical spike and a real chaotic situation, becomes a fundamental skill for those who wish to navigate the modern world not only efficiently but intelligently.